
Company data analytics: how it works and why it matters
A practical guide to company records, entity resolution, data quality, segmentation, and the evidence needed for reliable analysis.
- written by
- Adewale ThomasMixRank
- published
- 16 November 2026
- reading time
- 18 min
- filed under
- Data Buyer's Guide
A sales operations team opens its account report and finds a promising growth segment. Then an analyst notices that a company appears under both its legal name and its trading name, an acquired business is still classified as independent, and a hiring signal comes from an old posting. The report looks precise, but the account list needs checking before anyone acts.
Company data analytics depends on decisions made before the dashboard exists. Which records belong to the same organization? Which attributes are current enough for the task? Those choices determine whether a segment, trend, or forecast describes business activity or problems in the underlying records.
Company data types and the questions they answer
Company data analytics is the practice of collecting, linking, and analyzing records about organizations, their people, hiring, technology, and applications, usually drawn from publicly available information. Analysts use those records to answer business questions rather than assemble company profiles.
Firmographic records provide the starting point: industry, location, and legal identity. Employee-count history adds direction, while funding and ownership establish whether capital or control has changed. The surrounding signals help teams investigate timing, relationships, and technology adoption.
| Data type | What it describes | Business question it answers | Typical team |
|---|---|---|---|
| Firmographic records | Industry, location and legal profile | Which companies fit our ideal customer profile? | Sales and marketing |
| Employee count and headcount history | Workforce size and its change over time | Is this account growing or shrinking? | Sales and competitive intelligence |
| Funding and ownership | Investment rounds, investors and ownership links | Which companies have fresh capital or a new parent? | Investment research |
| Job postings | Open roles and posting history | Where is hiring demand moving? | Recruiting and workforce intelligence |
| Web technographics | Technologies used on company websites | Which tools does an account already run? | Data platform and sales operations |
| Mobile apps and SDKs | Applications, embedded SDKs and publisher links | How is an organization's app footprint changing? | Mobile intelligence |
| People and employment history | Professional profiles, roles, tenure and location | Who holds the buying or hiring role? | Sales and recruiting |
| Developer activity | Public repositories and organizational links | Which engineering teams are building in a given area? | Developer tools and research |
Start with the business question
An account-routing project needs firmographics before developer activity. An application-intelligence project needs publisher relationships and SDK information before funding history. More fields don't automatically make an analysis more useful.
MixRank's company data covers 120M+ companies, 30M+ of them with employees on file, with 150+ fields, delivered as an API, flat file, or hosted database. Its job data includes 1.5B+ job postings, with history back to 2021, alongside 250+ fields in the people schema. Those figures describe dataset and schema coverage. Individual company and people records may have unpopulated fields.
How company records move from source to analysis
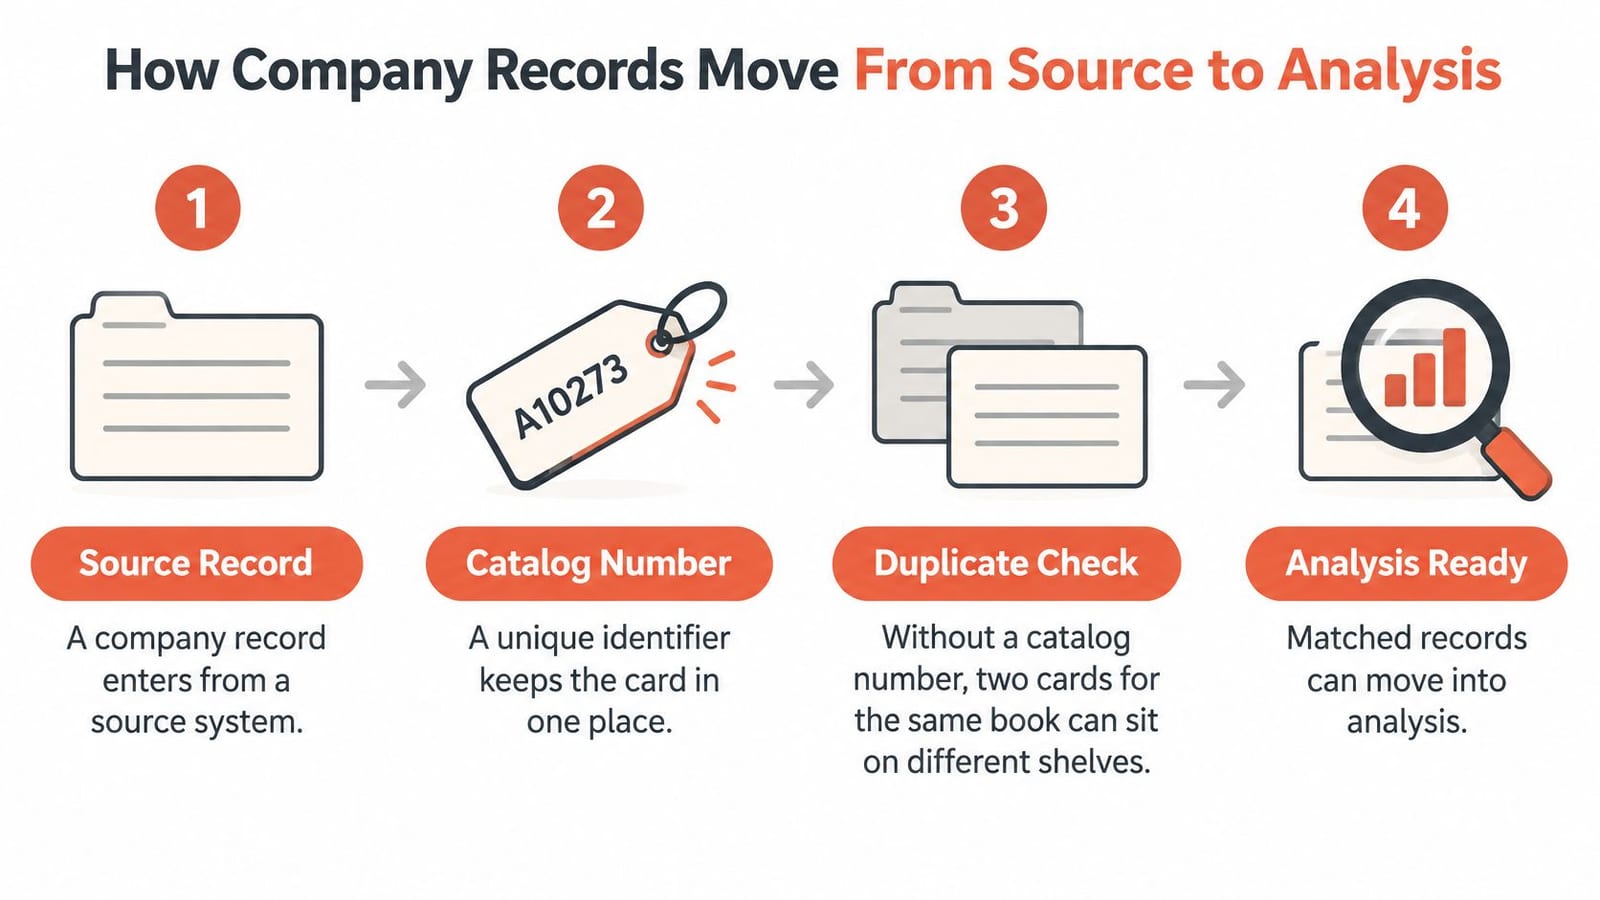
A company record works like a library catalog card. Without a catalog number, cards for the same book can sit on different shelves, leaving a librarian unsure whether they describe duplicates or separate books.
A company identifier serves a similar purpose, but assigning one requires preparation. A name alone isn't enough to establish identity.
Build the pipeline in a deliberate order
- 01Collect publicly available information on a set schedule. Preserve the context needed to interpret incoming records. A posting observation and a legal-company attribute describe different things, even when both mention the same organization.
- 02Normalize names, domains, addresses, and industry labels. Standard formatting makes comparisons possible. Normalization should retain the original value so analysts can investigate a transformation that removed meaningful detail.
- 03Resolve duplicates and assign a shared company ID. Link records only after checking the evidence. A subsidiary and its parent may share branding without being interchangeable analytical units.
- 04Timestamp fields and preserve change history. Store when an attribute was observed and when it entered the system. Overwriting the previous value destroys the ability to reconstruct an earlier account state.
- 05Deliver records into a warehouse or API. Apply schema checks and maintain ingestion logs so failed updates do not cause downstream tables to be incomplete.
- 06Analyze joined segments, trends, and backtests. Define the company population and time window before counting results. Otherwise, changes in coverage can be mistaken for changes in business activity.
Stable identifiers have a concrete public example: the SEC's CIK lookup describes the Central Index Key used to identify disclosure filers across its computer systems. An identifier connects attributes and documents that would be harder to reconcile by name alone.
Preserve connections through delivery
MixRank's six datasets link to one company ID, so headcount, web stack, open roles, apps, and people share the same company record. This makes questions spanning hiring and technology answerable without treating each feed as an isolated table.
Its delivery statement is specific: new and changed records reach your feed every hour. That doesn't mean every record changes hourly. A job change becomes a timestamped event in the next update file once the service picks it up.
Skipping duplicate resolution creates a predictable failure: a legal name and a shortened trading name remain separate, and the pipeline report counts the same company twice.
Why data quality decides the outcome
Dataset size alone doesn't guarantee a reliable decision. In a 2023 survey conducted by Drexel University's Center for Business Analytics with Precisely, only 46% of respondents reported high or very high trust in decision-making data, while 60% said poor data quality hindered integration, according to the survey figures summarized by MarTech Cube.
For a B2B team, those problems surface as manual account checks and joins nobody fully trusts. An advanced model won't repair an ownership field attached to the wrong organization.

Monitor quality at field level
A practical quality report should cover these dimensions:
- Completeness: Required attributes are present, with missing values distinguished from confirmed absence.
- Consistency: Industry labels, locations, and identifiers follow compatible definitions across tables.
- Accuracy: Values agree with the evidence available for the correct entity.
- Relevance: Fields support the intended decision.
- Timeliness: Observations are recent enough for the business action they inform.
A hypothetical ownership error shows why these checks matter. An account snapshot labels a company independent even though an earlier ownership event recorded a new parent. A campaign intended for independent businesses then includes an ineligible account, and its response enters the wrong segment's performance report.
The analyst should inspect the ownership event, its effective date, and the transformation that produced the snapshot. Refreshing the whole company record may reproduce the same mistake.
Separate evidence from estimation
An observed value might record that a job posting was visible on a particular date. A modeled estimate, such as derived headcount, reflects an inference rather than a direct count. Both can be useful, but they shouldn't carry identical evidence labels. A forecast that mixes the two can treat a modeled figure as a confirmed observation.
Field freshness works like expiry dates on a stocked shelf: the newest item says nothing about the rest. Website technology can change on a different schedule from a registered address, so a new address observation shouldn't reset the apparent age of an unchanged technology observation.
An ingestion table should retain observation time, ingestion time, evidence status, and any effective-validity interval. Analysts can then separate late-arriving information from a genuine business change.
Quality management also needs an owner and a response procedure. Missing ownership fields might trigger review, while an expired hiring observation might remove an account from a timing-sensitive campaign. Data quality is an ongoing measurement practice with a named owner, a set review cadence, and defined triggers for each response.
Matching records to the right company
A single match rate is misleading because it doesn't distinguish correct links from dangerous combinations. Entity resolution is the process of deciding when records describe the same company.
Precision measures the share of accepted links that are correct. Recall measures the share of true links the process recovers. A system can link many records while still combining companies that should remain separate.
| Match outcome | What happens | Effect on analysis | Control |
|---|---|---|---|
| Correct match | Two records for one company are linked | Clean headcount and funding history | Deterministic keys and domain matching |
| False merge | Two different companies are combined | Inflated headcount and misattributed hiring | Parent-subsidiary rules and human review |
| Missed match | One company stays split across records | Undercounted accounts in an individual segment and duplicate outreach | Normalized names and address features |
| Ambiguous pair | Score falls between the acceptance and rejection thresholds | Uncertain segment membership | Routing to a review queue |
Check identity before similarity
The workflow should begin with deterministic keys, such as a reliable legal identifier. Next come normalized legal names and domains, followed by geography, address, and explicit parent-subsidiary rules.
Domains provide useful evidence, but they cannot prove identity on their own. Related companies can share a website, while a single organization can operate several domains. Similarly, matching addresses may indicate a shared office rather than a shared legal identity.
For ambiguous pairs, a probabilistic score can combine evidence. The score should support distinct outcomes:
- Automatic acceptance: Strong evidence satisfies the approved rule without conflicting identity signals.
- Human review: Evidence is incomplete or contradictory, especially around ownership relationships.
- Rejection: The available evidence doesn't support a link.
Evaluate the analytical cost
A false merge can combine workforce counts, attach an unrelated funding round, and attribute one company's hiring to another. That contamination can affect several downstream analyses at once. A missed match may leave a fragmented account view, but it doesn't necessarily corrupt the attributes of another company.
The relative cost still depends on the task. Duplicate outreach may be particularly costly for an account-management workflow, while a false merge may be unacceptable in investment screening.
Evaluation should include both record pairs and the final clusters formed by those links. A chain of individually plausible matches can still create an implausible company cluster.
Teams should report precision and recall by country, language, industry, and company-size band, rather than hiding weak segments inside an overall score. Versioned match decisions, model settings, and review labels allow analysts to rerun a backtest against the identity rules used at the time.
Segmentation and enrichment criteria that drive decisions
A campaign brief might read: mid-market logistics firms, currently hiring engineers, not already running a competing analytics tool. Turning that sentence into an account list takes two different operations. Segmentation groups accounts by shared attributes. Enrichment appends those attributes to records already held in a CRM or data platform.
The distinction matters operationally. An enriched record may contain useful hiring information without qualifying for a campaign, because campaign membership also requires an explicit rule. Enrichment fills the fields. Segmentation decides who gets in.
| Criterion | Field drawn on | Example segment | Decision it supports |
|---|---|---|---|
| Employee count | Workforce size and headcount history | Companies within the approved mid-market employee band | Account tier and capacity planning |
| Industry and location | Firmographic classification and address | Logistics firms headquartered in Germany | Territory assignment |
| Hiring activity | Open roles and posting history | Companies with open engineering roles this quarter | Outreach timing |
| Technology in use | Web technographics | Accounts running a named analytics tool | Cross-sell offer |
| Funding and ownership | Funding records and investor links | Venture-backed firms that raised a round in the last year | Prioritizing new accounts |
| Leadership change | People and employment records | Accounts where a new head of data appears | Champion outreach |
Combine fit with timing
Employee count sets account scale, hiring activity signals timing, and only a product-specific technology observation shows fit. Combining the three produces a more specific hypothesis worth testing.
For a hypothetical campaign, the analyst first selects the approved employee band and industry. Posting history then identifies accounts with relevant hiring activity during the chosen quarter. A current technology observation determines whether the proposed offer is compatible with the account's existing environment.
Company database records supply the inputs for each filter: industry classifications and posting histories captured from the field rather than self-reported, plus employee-count estimates. Matched records, delivered in hourly update files, can also stream through an API into a CRM, workflow tool, or platform, so the segment rebuilds on current observations rather than on a stale export.
Make membership reproducible
Each criterion needs a time rule tied to how fast that field moves. Postings change quickly, so "open engineering roles" might reasonably mean observed within the quarter. Headcount moves more slowly, and because the record carries a month-by-month employee-count history stretching back years, the analyst can require the latest observed count rather than accept whichever value happens to sit on file.
Missing data also needs an explicit outcome, and the risky case is a silent zero. Suppose the campaign targets accounts that do not use the named tool, and the query returns 400 companies. If 60 of them lack any technology observation, classify their status as unknown and leave them out of the confirmed non-user count. Counting them as non-users inflates the segment to 400 and routes outreach to accounts that may already run the product. The safer rule keeps the target segment at the 340 verified non-users and sends the rest back for enrichment.
- Define the population: Specify eligible company types and whether subsidiaries qualify independently.
- Store the membership reason: Retain the fields and observation dates that caused inclusion.
- Control overlap: Reuse centrally defined segment rules and deduplicate combined audiences by company ID.
Overlapping criteria can place the same account in several campaigns. That isn't necessarily wrong, but adding segment totals without deduplication inflates the account count. Reporting should distinguish segment membership from unique accounts.
Company data analytics in practice
The following hypothetical scenarios use similar company records but require different evidence. Each begins with a business decision, then identifies the fields needed to support it.
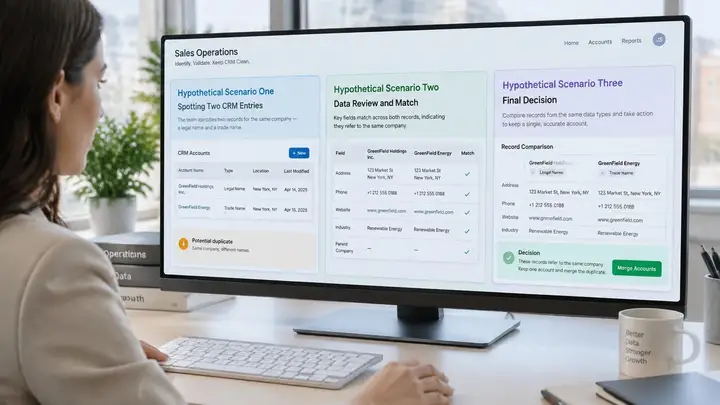
Hypothetical scenario involving sales operations
A sales operations analyst finds CRM entries under a legal name and an abbreviated trading name. Before merging, the analyst checks whether both resolve to the same company ID, because an abbreviation can also belong to a subsidiary that should remain a separate account.
The decision is to count the organization once without deleting legitimate opportunity records. That requires the shared identifier, current ownership information, and enough mapping history to explain why pipeline totals shifted between reporting periods.
Hypothetical scenario involving recruiting
A recruiting platform enriches candidate records with employer and role information, then uses posting history to identify employers that have advertised for a relevant skill.
Each posting needs a status label tied to an observation date. A role advertised for 30 days and then withdrawn should appear in the feed as a closed posting with a removal timestamp. The platform stops surfacing it as a live vacancy while retaining the evidence that the employer hired for that skill. An employer with several recent postings in one function becomes a candidate for outreach, and the platform's output is a ranked list of employers with the dates behind each signal. Employer hiring activity still says nothing about whether an individual candidate intends to move.
Hypothetical scenario involving competitive intelligence
A competitive intelligence analyst notices that a rival's engineering department is expanding while other departments remain comparatively stable. Before attributing the change to product investment, the analyst checks the sequence of dated observations. A gradual rise across several months reads differently from a single jump, which can come from a classification adjustment such as contractors being relabeled as engineers.
This case needs a stable company boundary, dated departmental observations, and enough history to separate a sustained trend from a one-time reclassification.
The analyst's output is a recommendation to investigate further, with the dates and departments attached.
For a hiring backtest, the available 1.5B+ job postings, with history back to 2021, allow an analyst to investigate whether a proposed signal preceded past outcomes. The test must use only information available at the historical decision date, with later corrections kept out of the sample.
The same broad question about company growth can require ownership, employment, or posting fields. The team should start with the decision and work backward to the necessary evidence.
Confirm the evidence threshold before you build
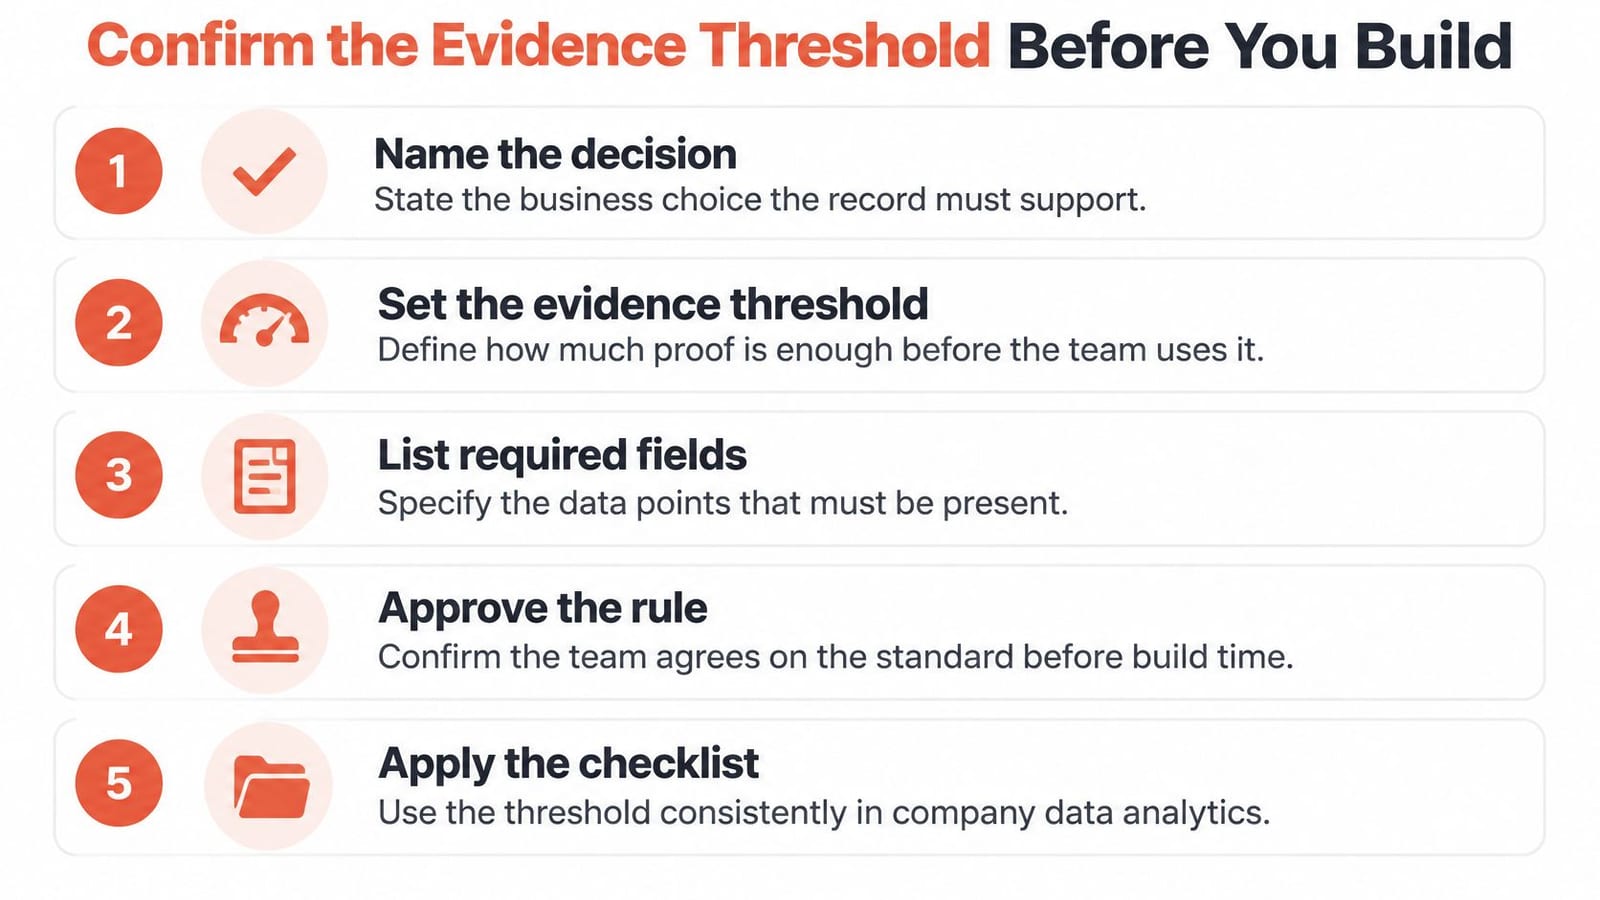
An evidence threshold defines when a record is reliable enough for a particular action. A broad research shortlist can tolerate uncertainty that an automated account reassignment cannot.
The threshold should be agreed before implementation. Otherwise, engineers must guess how missing fields, conflicting matches, and late updates should affect business actions.
Apply the acceptance checklist
- 01Name the decision and minimum fields. Working from the question mapping in Company data types and the questions they answer, state the action, responsible owner, and attributes required to authorize it. Separate useful context from mandatory evidence.
- 02Set a freshness target for each field. How company records move from source to analysis explains how timestamps travel with each record. The decision here is the maximum age each required field can reach before an observation expires, and what the system does after expiry.
- 03Choose stricter rules for modeled values. Using the quality labels from Why data quality decides the outcome, decide which derived fields need human review or a higher evidentiary bar before they can trigger an action.
- 04Set a matching floor per segment. Matching records to the right company describes the labelled-sample method. Agree on the minimum precision and recall each segment must reach, and settle in advance how ties and uncertain labels count toward the result.
- 05Decide the lookback a test must cover. Company data analytics in practice shows how snapshots support retrospective tests. The decision is the outcome window a backtest needs to span before the team trusts its conclusions.
- 06Set operational acceptance for delivery. Define the delay the receiving system can tolerate between a source change and its arrival in the warehouse, plus how the pipeline must handle retries and reprocessing when a file arrives late.
Compare evidence on equal terms
Sources should be evaluated against the same labelled test set. Each should receive identical company pairs, required fields, and acceptance rules, so the team compares results rather than differently defined coverage claims.
The test should also measure decision consequences. Analysts can inspect which accounts changed segment after a corrected merge, which ownership updates changed routing, and which expired observations would have triggered inappropriate outreach.
Those findings then need a written pass/fail rule. A workable one reads: the feed qualifies when every mandatory field meets its freshness target, matching precision on the target segment clears the floor agreed before testing, and no automated action can fire on a modeled value flagged for review. The feed scales only after a sample run satisfies that rule.

Adewale Thomas
Adewale Thomas writes about technology and workforce data at MixRank, where he spends his time between sales-call transcripts, query logs, and the datasets themselves.